⚔️Armor Games Data Analysis: Past and Present of Web Gaming Market
📊Data 🎮Game 📈Analytics 🌐Web Games 💰Market Research
Background
Armor Games holds a special place in the history of web gaming platforms. Since its establishment in 2007, it has been at the center of the web gaming ecosystem, connecting developers and players from the Flash gaming golden era to today’s HTML5 age. Among these, series like Kingdom Rush, The Last Stand, Raze, and Learn to Fly are considered icons representing the golden age of Flash games. Each game has been beloved for a long time with innovative gameplay and high quality across various genres including strategy, action, defense, shooting, and puzzle.
The Great Transformation of the Web Gaming Market
The web gaming industry has undergone dramatic changes over the past decade. Steve Jobs’ decision to reject Flash support on the iPhone in 2010 and Adobe Flash’s official end of support in 2020 signified a paradigm shift for the entire web gaming ecosystem. As Flash games disappeared into history, new HTML5-based games began to fill their place.
Analysis Purpose
Recently, my game was accepted on Armor Games, which sparked my curiosity.
What does Armor Games look like these days? I wanted to understand it through data.
Therefore, in this analysis, I will examine the changes in the web gaming market through Armor Games’ data from the past 7 years (2018-2025). By examining game quality changes, genre trends, and differences between past and present through data, I aim to provide useful market insights for game developers like myself.
Data Preparation
Data Collection
The data used for analysis consists of metadata for games published on the Armor Games site as of May 24, 2025. Each game includes information such as title, genre, play count, rating, favorite count, and release date.
Preprocessing
Period Filtering
Among the original 1,013 games, only games released after January 1, 2018, were selected for analysis, filtering down to 999 games. This was to understand trends from the period when Flash support termination and HTML5 transition began in earnest.
Technology Stack Classification
Games were classified as follows:
- HTML: 924 games (92.5%): HTML5/JavaScript-based
- Unknown: 75 games (7.5%): Games without specified technology information, but upon examination, they are essentially HTML
Although I attempted technology stack classification thinking Flash might appear to some degree, no games were classified as Flash. This suggests that most Flash games have either been ported to HTML5 or removed from the platform.
Genre Refinement
While the original data contained 154 various categories, meta-information unrelated to actual game genres was excluded:
- Year badges (GAMES OF 2018, etc.)
- Input methods (MOUSE ONLY, KEYBOARD ONLY, etc.)
- Game features (MULTIPLAYER, SPEEDRUN, etc.)
- Visual styles (PIXEL, MINIMALISM, etc.)
Through this process, 138 pure genre tags were extracted.
Final Dataset
After preprocessing, 999 games total and 138 pure genre tags became the analysis targets. The yearly distribution varies from 192 games in 2018 to 35 games in 2025 (since we’re still in mid-2025), and based on this data, I will analyze trends and patterns in the web gaming market.
Data Analysis
Overall Situation Assessment
Basic Game Statistics
Let’s examine the overall status of the 999 games in our analysis.
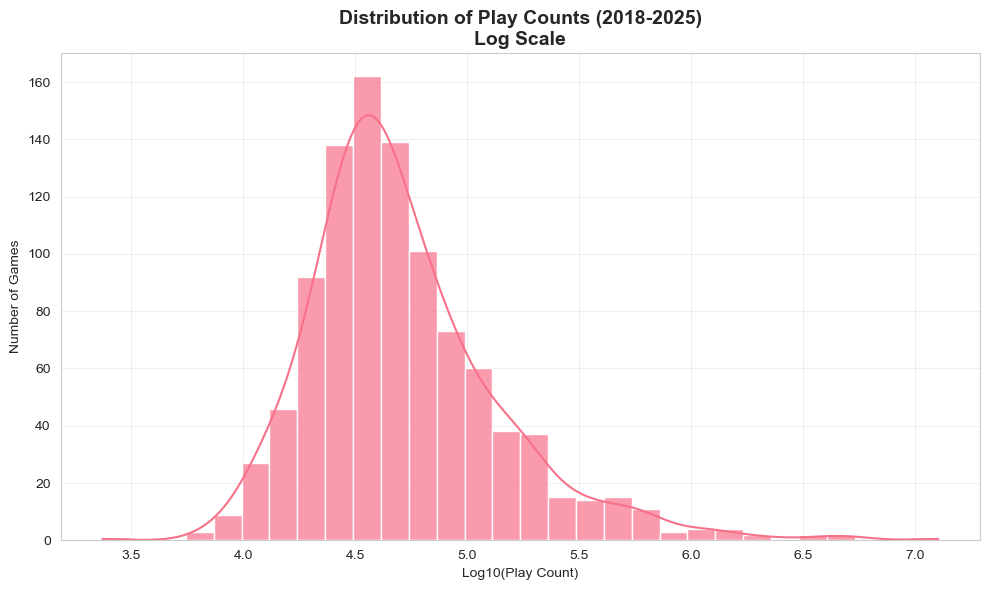
Play Count Distribution
- Average play count: 122,158 plays
- Median: 42,820 plays
- Since the average is about 3 times higher than the median, we can see that a small number of popular games drive up the overall play count.
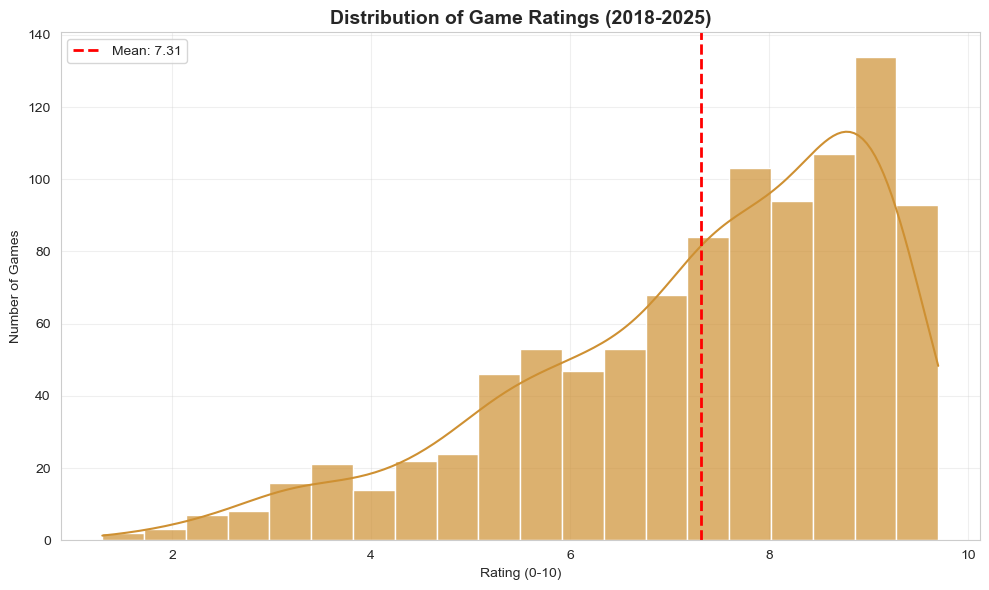
Rating Status
- Average rating: 7.31/10 points
- Shows generally good quality levels, indicating Armor Games’ curation effect.
Favorites
- Average favorites: 269
- Suggests that players are not just playing games but actively saving games they like.
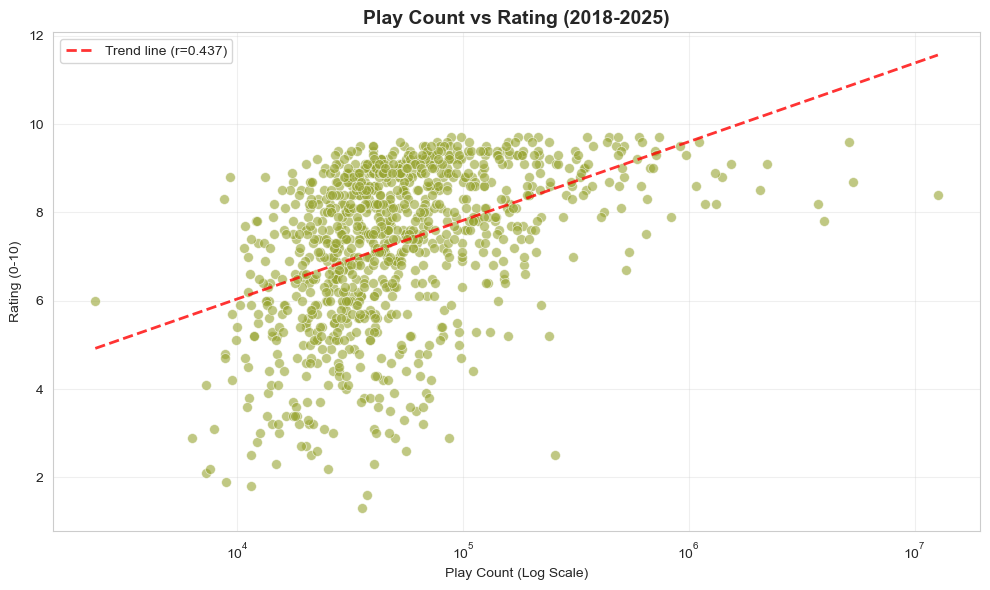
Correlation Analysis
Looking at the relationships between game success indicators:
- Play Count ↔ Rating: 0.126 (weak positive correlation)
- Play Count ↔ Favorites: 0.712 (strong positive correlation)
- Rating ↔ Favorites: 0.298 (moderate positive correlation)
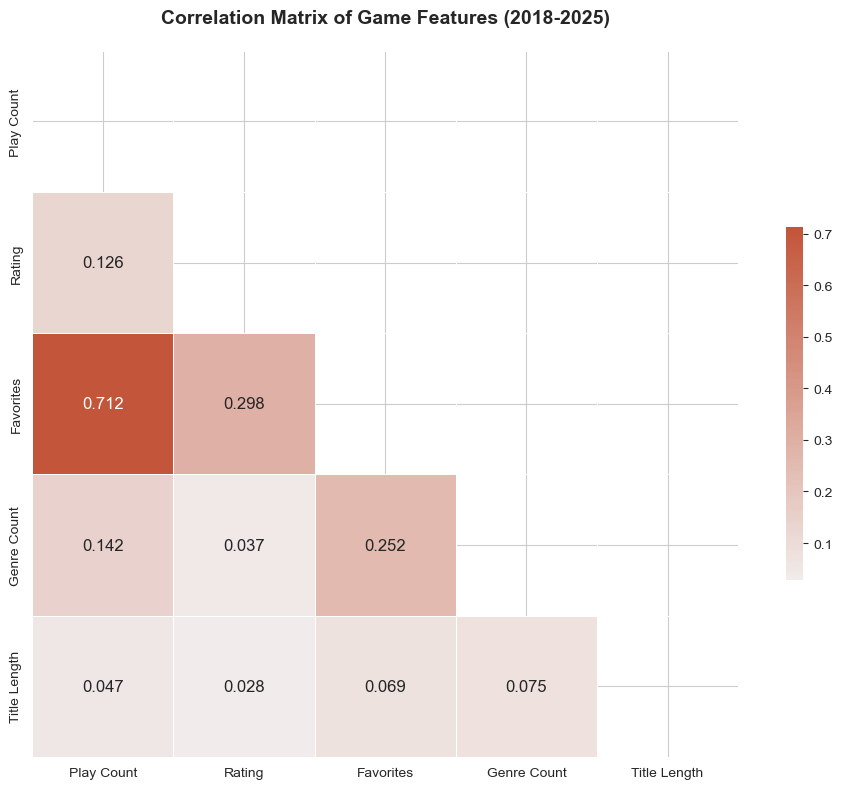
Interestingly, high ratings don’t necessarily lead to high play counts. This suggests that game quality and popularity are separate factors.
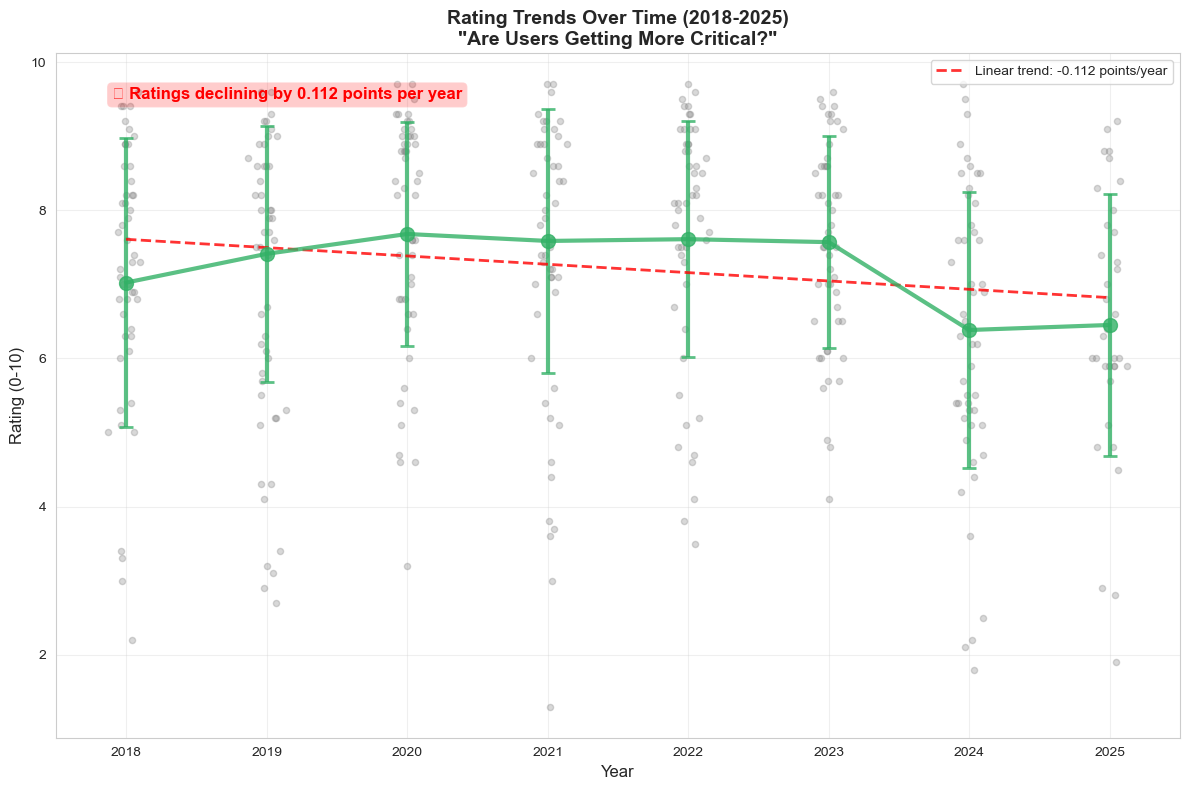
User Evaluation Trends: “Are Users Getting More Critical?”
Analysis of yearly rating changes reveals a consistent downward trend:
- 2018: 7.02 points
- 2019: 7.41 points (peak)
- 2020: 7.68 points
- 2021: 7.58 points
- 2022: 7.61 points
- 2023: 7.57 points
- 2024: 6.38 points (sharp decline)
- 2025: 6.45 points
Particularly notable is the sharp decline starting from 2024, with average ratings dropping about 0.57 points from 2018 to 2025.
This can be interpreted as follows:
- Rising evaluation standards: Users’ expectations for web games have increased
- Increased choice: With various gaming platforms and options, comparison standards have become more demanding
- Quality threshold: Moving away from the era when games received good ratings just for “working” to requiring higher completion levels
Genre Deep-Dive Analysis
Popular Genre Tag Status
Analysis results show the most frequently used top genre tags:
Top 5 Genre Tags
- PUZZLE-SKILL: 335 games (33.5%), puzzles where reflexes and skill are important
- PUZZLE: 245 games (24.5%), traditional puzzles centered on logical thinking
- PLATFORM: 208 games (20.8%)
- ADVENTURE: 208 games (20.8%)
- PUZZLE PLATFORMER: 159 games (15.9%)
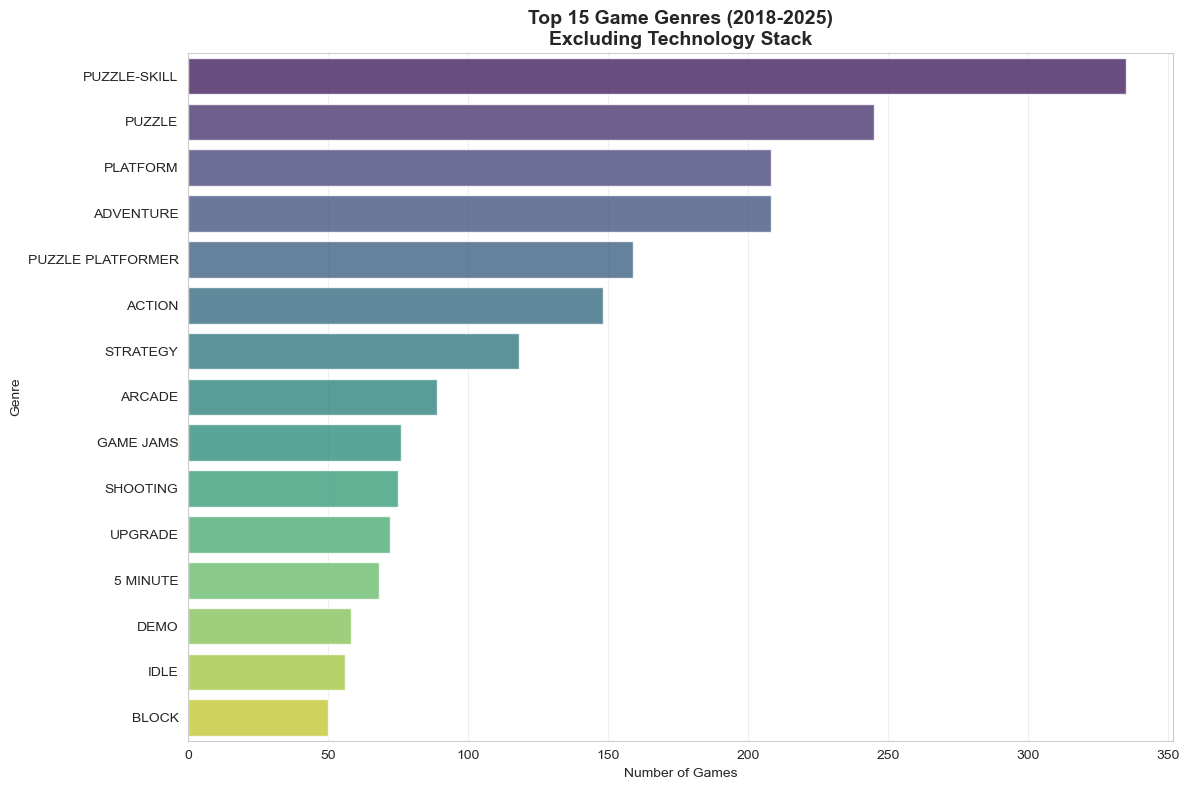
Interestingly, puzzle-related genres overwhelmingly take first place. Simply combining PUZZLE-SKILL and PUZZLE reaches 58% of all games. However, analyzing the data more carefully: 175 games have only PUZZLE-SKILL, 85 games have only PUZZLE, and 160 games have both tags, so the union calculation gives 420 games, 42.0% of the total. Still not a low figure. This shows that puzzle games, which are easily accessible and enjoyable in short periods, remain core content for web games due to their characteristics.
Genre Performance Matrix: Quality vs Popularity
Analyzing each genre’s average rating and total plays reveals interesting patterns:
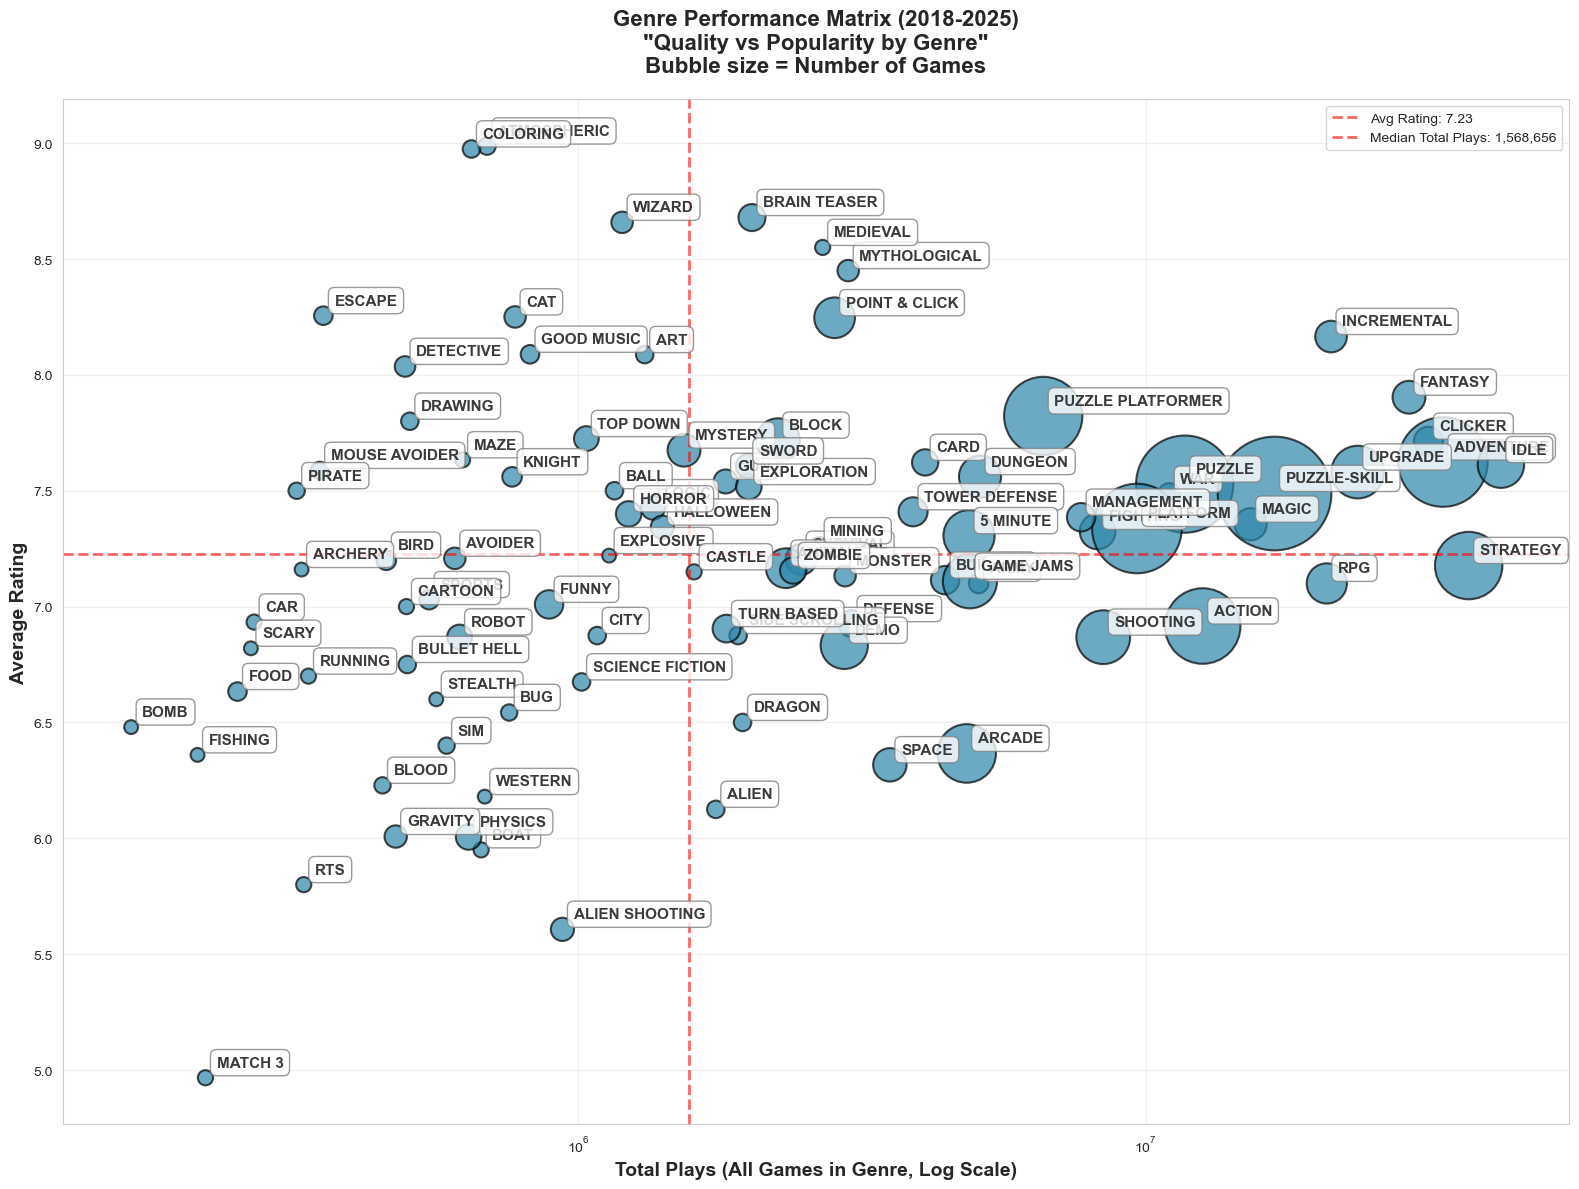
High Quality + High Popularity Genres
- IDLE: 7.61 average rating, 42,231,837 total plays (56 games)
- STRATEGY: 7.18 average rating, 37,056,214 total plays (118 games)
- FANTASY: 7.90 average rating, 29,089,133 total plays (28 games)
High Quality + Low Popularity Genres (Hidden Gems)
- ATMOSPHERIC: 8.99 average rating, 690,893 total plays (8 games)
- COLORING: 8.98 average rating, 648,726 total plays (8 games)
- BRAIN TEASER: 8.68 average rating, 2,024,339 total plays (19 games)
- WIZARD: 8.66 average rating, 1,195,289 total plays (12 games)
Low Quality + High Popularity Genres
- CLICKER: 7.71 average rating, 31,477,409 total plays (22 games)
- ADVENTURE: 7.62 average rating, 33,380,957 total plays (208 games)
Recent Trends: Genre Evolution (2023-2025)
The gaming landscape has continued evolving in recent years, with 51 qualifying genres (≥3 games each) showing distinct patterns in the 2023-2025 period. This analysis reveals how player preferences and developer focus have shifted in the modern web gaming era.
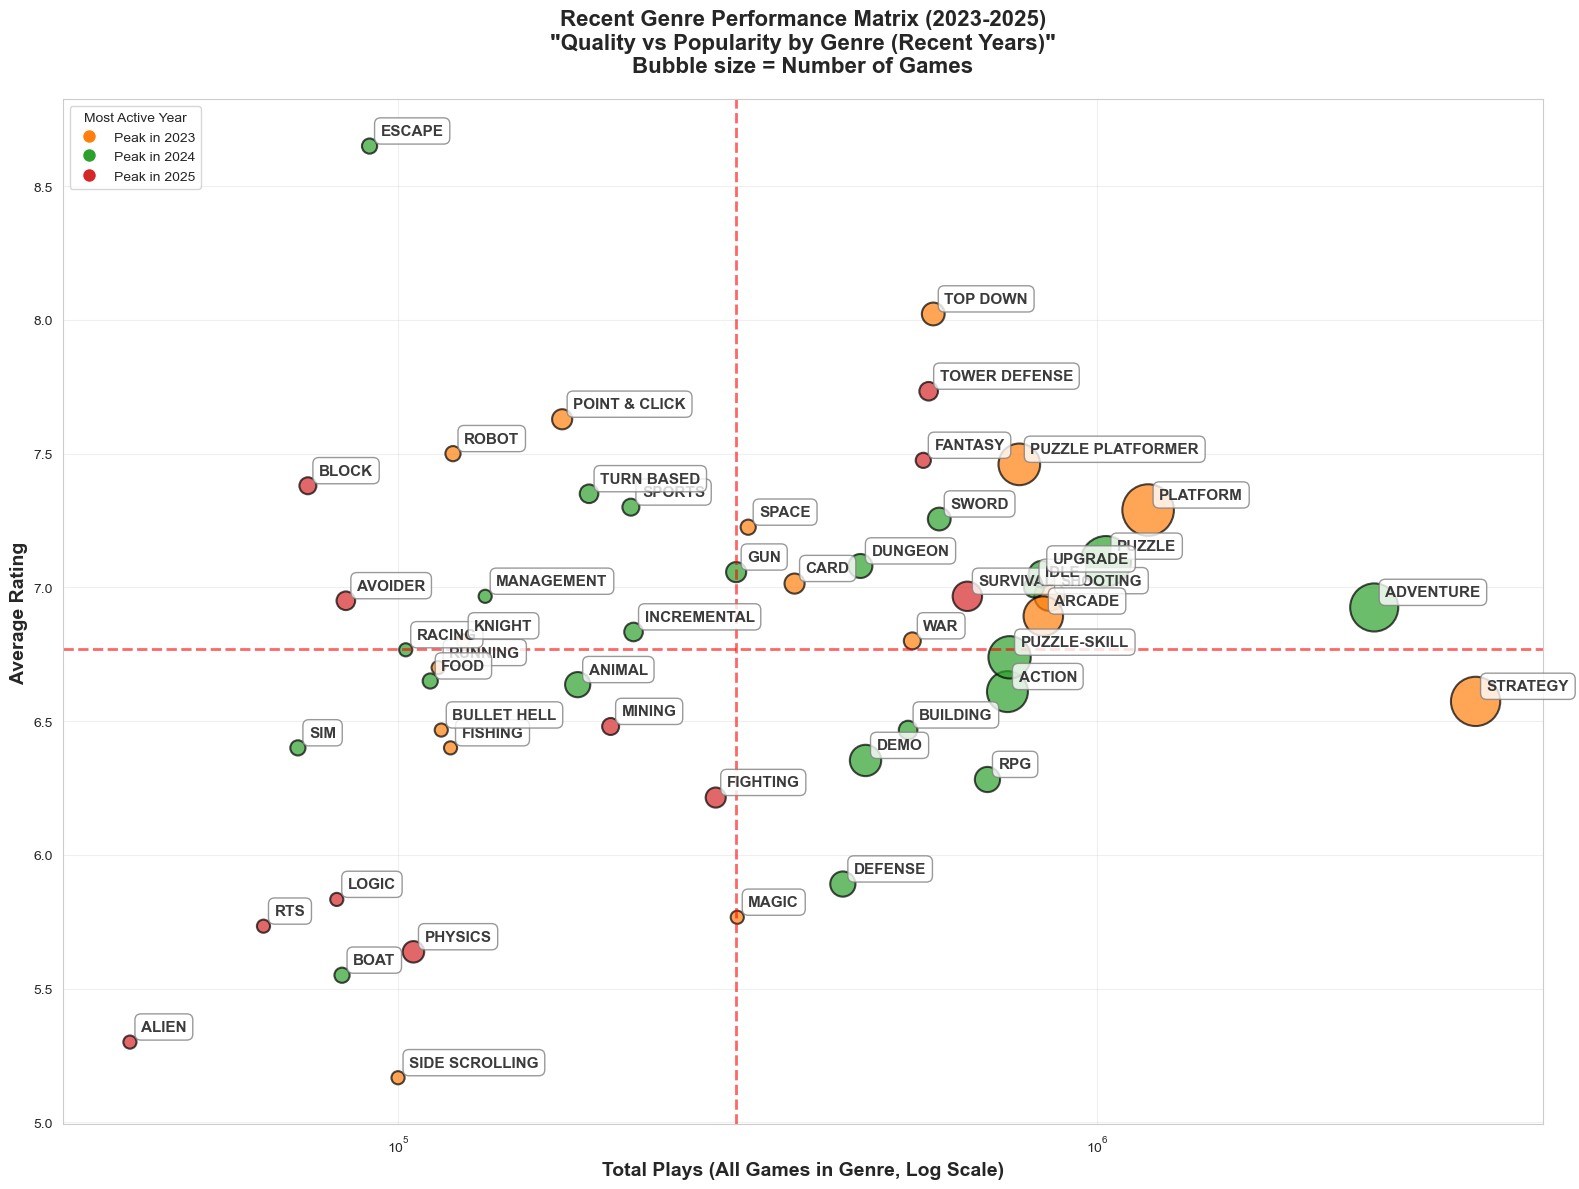
Quality Leaders in Recent Gaming
The highest-rated genres of recent years demonstrate sophisticated game design and player satisfaction:
- ESCAPE: Leading with 8.65 average rating despite modest 91,042 total plays across 4 games, peaking in 2024
- TOP DOWN: Strong 8.02 average rating with 583,261 total plays across 9 games, peaked in 2023
- TOWER DEFENSE: Maintaining quality at 7.73 average rating with 574,494 total plays across 6 games, showing growth into 2025
- POINT & CLICK: Classic genre sustaining 7.63 average rating with 171,718 plays across 7 games, peaked in 2023
- ROBOT: Niche but polished at 7.50 average rating with 119,847 plays across 4 games, peaked in 2023
Popularity Champions: Volume Leaders
Recent high-traffic genres show where the player base concentrates:
- STRATEGY: Dominating with 3,482,821 total plays across 42 games, though with moderate 6.57 average rating, peaked in 2023
- ADVENTURE: Strong runner-up with 2,493,771 total plays across 40 games and improving 6.92 average rating, peaked in 2024
- PLATFORM: Solid performance with 1,183,929 total plays across 46 games and healthy 7.29 average rating, peaked in 2023
- PUZZLE: Consistent favorite with 1,030,126 total plays across 44 games and decent 7.10 average rating, peaked in 2024
- SHOOTING: Concentrated appeal with 855,592 total plays across 16 games and 6.97 average rating, peaked in 2023
Production Powerhouses: Most Active Genres
The genres with highest development activity reveal industry focus areas:
- PLATFORM: Leading production with 46 games, achieving strong 7.29 average rating and substantial 1,183,929 total plays
- PUZZLE: Close second with 44 games, maintaining 7.10 average rating and impressive 1,030,126 total plays
- STRATEGY: High volume at 42 games driving massive 3,482,821 total plays, though with lower 6.57 average rating
- ADVENTURE: Steady production of 40 games yielding strong 2,493,771 total plays and improving 6.92 average rating
- PUZZLE-SKILL: Growing category with 31 games, 6.74 average rating and 750,038 total plays, peaked in 2024
The data reveals a maturing market where traditional genres like Strategy and Adventure maintain massive player bases, while newer categories like Escape and Top Down achieve exceptional quality scores. Platform and Puzzle games emerge as the most actively developed genres, suggesting strong developer confidence and sustainable player interest.
Past vs Present Comparison (2018-2022 vs 2023-2025)
To understand how the web gaming market is changing, I’ll compare the past 5 years (2018-2022) with the recent 3 years (2023-2025).
Genre Rating Trends
Tracking quality changes of each genre over time:
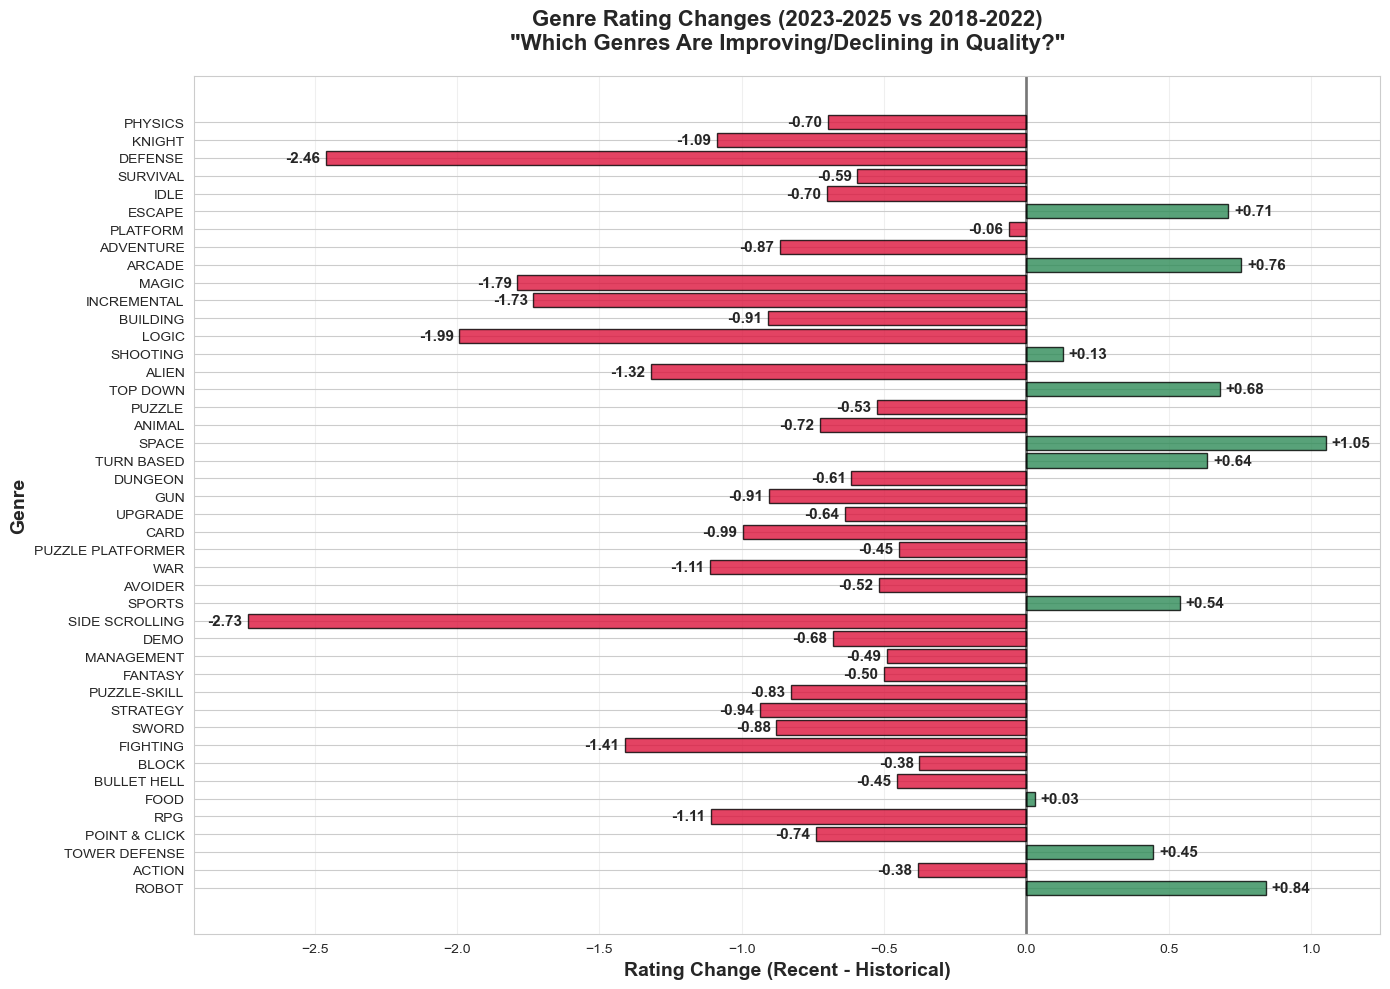
Improving Genres
- SPACE: +1.05 points/year (6.17 → 7.22 points)
- ROBOT: +0.84 points/year (6.66 → 7.50 points)
- ARCADE: +0.76 points/year (6.14 → 6.89 points)
Declining Genres
- SIDE SCROLLING: -2.73 points/year (7.90 → 5.17 points)
- DEFENSE: -2.46 points/year (8.35 → 5.89 points)
- LOGIC: -1.99 points/year (7.82 → 5.83 points)
- PUZZLE-SKILL: -0.162 points/year (declining)
- PLATFORM: -0.105 points/year (declining)
- ADVENTURE: -0.176 points/year (declining)
Stable Genres
- PUZZLE PLATFORMER: Most stable (standard deviation: 0.25)
- PUZZLE: -0.081 points/year (slight decline)
- ACTION: -0.067 points/year (slight decline)
Yearly Genre Quality Heatmap
Visualizing rating changes of major genres from 2018 to 2025 in a heatmap allows us to see at a glance which years each genre performed best.
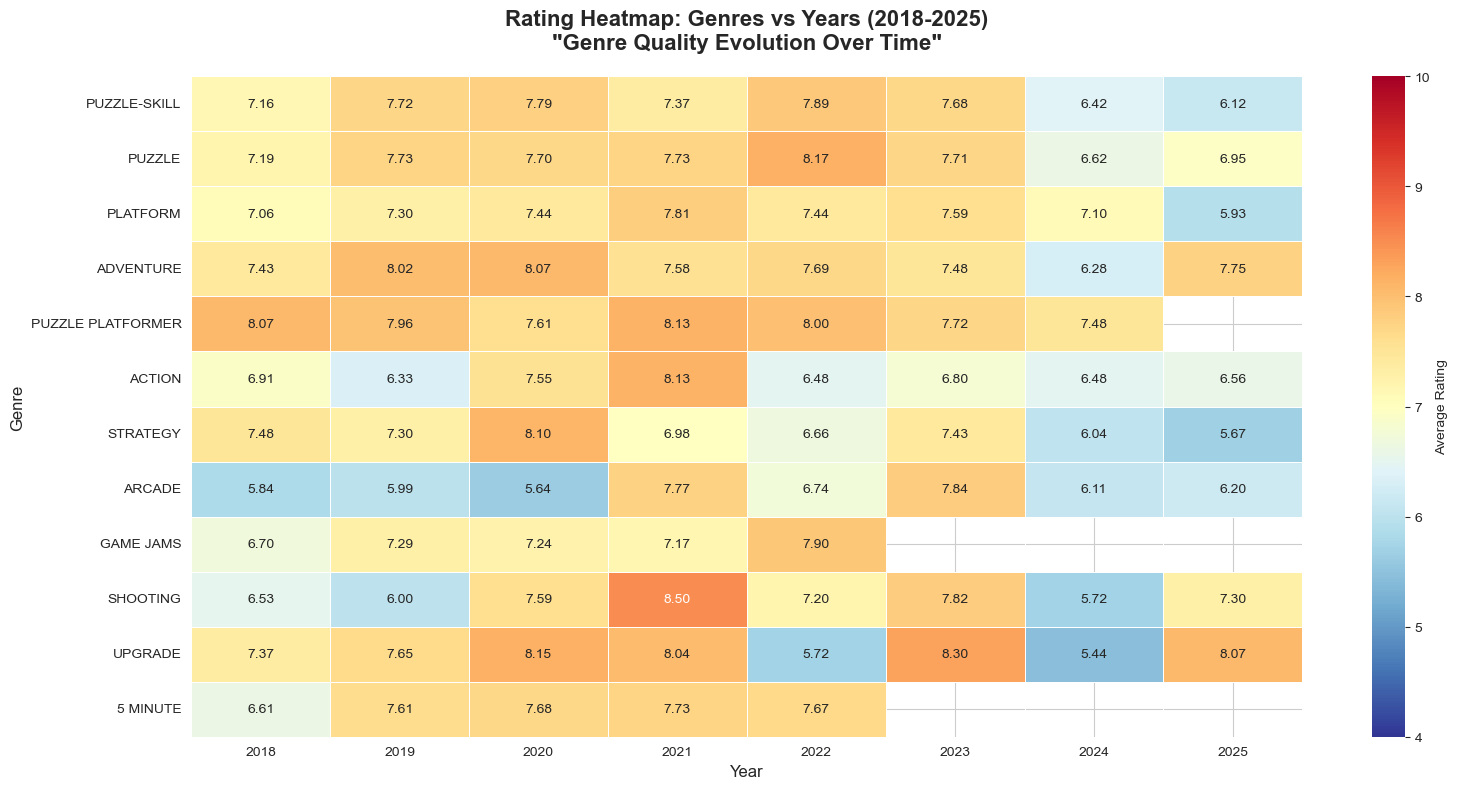
Through this analysis, developers can understand:
- Which genres are currently on the rise
- When specific genres enjoyed booms
- Historical performance patterns of genres they want to develop
Game Performance Matrix Comparison
Past (2018-2022)
- High quality (8.5+ points) games: 12.3%
- High popularity (top 25% plays) + High quality: 3.1%
Recent (2023-2025)
- High quality (8.5+ points) games: 14.7%
- High popularity (top 25% plays) + High quality: 4.2%
Interestingly, the proportion of high-quality games has actually increased. While overall average ratings have declined, there are more games of excellent quality. This may indicate polarization in game quality.
Hidden Gem Discovery
Through data analysis, let’s find games that are relatively unknown despite their high quality.
High-rated Low-play Games - 8.9+ points, bottom 25% play count (27,617 plays or less)
- Detective Bass: Fish Out of Water (9.3 points, 27,132 plays)
- Fill Up The Hole (9.2 points, 22,428 plays)
- Move Box (9.1 points, 27,490 plays)
- SYNTAXIA (9.1 points, 20,120 plays)
- Rotate Box (9.0 points, 24,418 plays)
- BRDG (9.0 points, 26,778 plays)
- Nova: Cloudwalker’s Tale (8.9 points, 25,855 plays)
- Sum Lines (8.9 points, 23,923 plays)
- Race Against a Duck (8.9 points, 27,085 plays)
- Menace from the Deep Demo (8.9 points, 17,464 plays)
The common point of these games is innovative game mechanisms and original ideas. Games that made new attempts rather than simply variations of existing genres are receiving high evaluations.
Conclusion
Key Insights Summary
1. Rising User Standards
The slight decline in average ratings should be interpreted as rising user evaluation standards rather than game quality deterioration. This signifies the maturation of the web gaming market.
2. Genre Evolution
- Rising: IDLE, STRATEGY, RPG - genres with deep gameplay
- Declining: ARCADE, ACTION - traditional action genres
- Stable: PUZZLE, ADVENTURE - core genres of web games
3. Quality Polarization
While overall averages declined, the proportion of high-quality games increased, showing a polarization phenomenon in quality.
4. Importance of Innovation
The common point of hidden gems is innovative mechanisms and originality. New attempts are the key to success rather than simple imitation of existing genres.
Implications for the Web Gaming Market
Advice for Developers
- Focus on Depth: Provide immersive experiences rather than simple casual games
- Pursue Innovation: Develop innovative variations of existing genres or new mechanisms
- Quality Focus: Quality-centered development approach rather than quantity
Market Outlook
The web gaming market is still thriving and evolving into a more sophisticated and demanding market. Even in competition with mobile or console games, there’s plenty of room for success if web games provide their unique value.
Future Prospects
With the end of the Flash era, the web gaming market has reached a new turning point. With the advancement of HTML5 technology, more sophisticated and innovative games are expected to emerge. Particularly, new web technologies like AI, WebGL, and WebAssembly will further expand the possibilities of web games.
If platforms like Armor Games continue to select and support high-quality games, web games will continue to play an important role in the gaming ecosystem. The unique strengths of web games - accessibility and creativity - will continue to be attractive options for many developers and players in the future.